Imagine walking into a boardroom where the CFO has a real-time financial dashboard in front of them, the Sales Head has live revenue metrics at their fingertips — and then the HR Head walks in with a printed spreadsheet from last week.
That scenario, unfortunately, still plays out in many organizations across India and globally. And it’s costing companies more than they realize — in lost productivity, delayed decisions, and missed people-insights.
This is where HR dashboards change everything.
An HR dashboard is not just a reporting tool. It is the command center for your entire people strategy. Whether you’re tracking attendance, monitoring attrition risk, managing payroll compliance, or measuring recruitment efficiency, the right HR dashboard gives you instant clarity — so you can lead with data, not gut feeling.
In this ultimate guide, you will learn all about HR dashboards – their meaning, the various types of HR dashboards that exist, how to build a dashboard, best templates and software for creating them, and many more interesting insights. No matter if you are a beginner in HR or already have considerable experience, you are going to find this guide very helpful.
What Is an HR Dashboard? Definition and Meaning
HR Dashboard Meaning
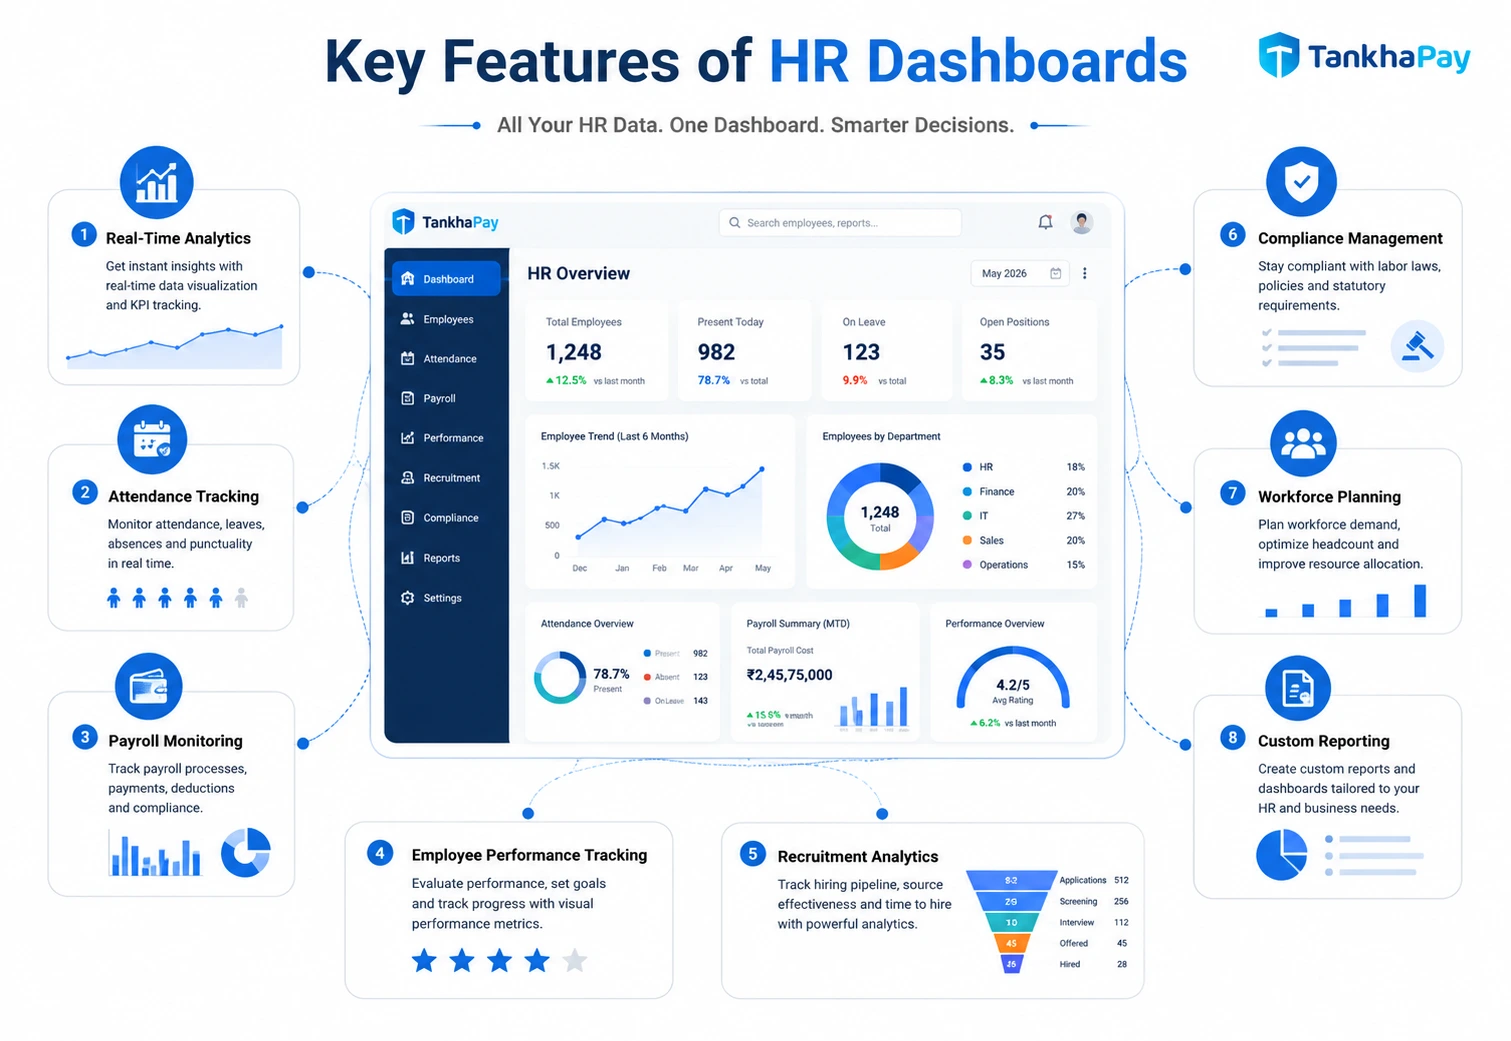
An HR dashboard is a visual data management tool that consolidates and displays key human resources metrics and KPIs (Key Performance Indicators) in a single, easy-to-read interface. It pulls data from various HR systems — payroll software, attendance tools, HRMS platforms, and recruitment systems — and presents that data through charts, graphs, tables, and scorecards.
In simpler terms, an HR dashboard answers the most critical question every HR leader and business decision-maker asks daily: “How are our people doing, and are we managing them effectively?”
HR Dashboard Definition: The Technical Angle
In terms of technology, the HR data dashboard can be described as a reporting interface that is placed over your HR information system. Structured data (like headcount, salary, etc.) as well as semi-structured data (e.g., survey answers and review results) are collected and then presented in the manner which helps you make quick and sound decisions.
Unlike static HR reports — which are snapshots of a single moment in time — a well-designed HR dashboard is dynamic. It updates automatically or on a scheduled basis, allowing HR teams and executives to monitor workforce trends in near real-time.
Dashboard in HR: Core Purpose
The core purpose of a dashboard in HR is to bridge the gap between raw workforce data and meaningful business decisions. It serves three primary functions:
- Monitoring — Track ongoing HR operations like attendance, payroll runs, headcount changes, and open positions.
- Analysis — Identify trends, anomalies, and patterns in workforce behavior and HR performance.
- Reporting — Share key insights with leadership, department heads, and board members in a concise, visual format.
Types of HR Dashboards Every Organization Should Know
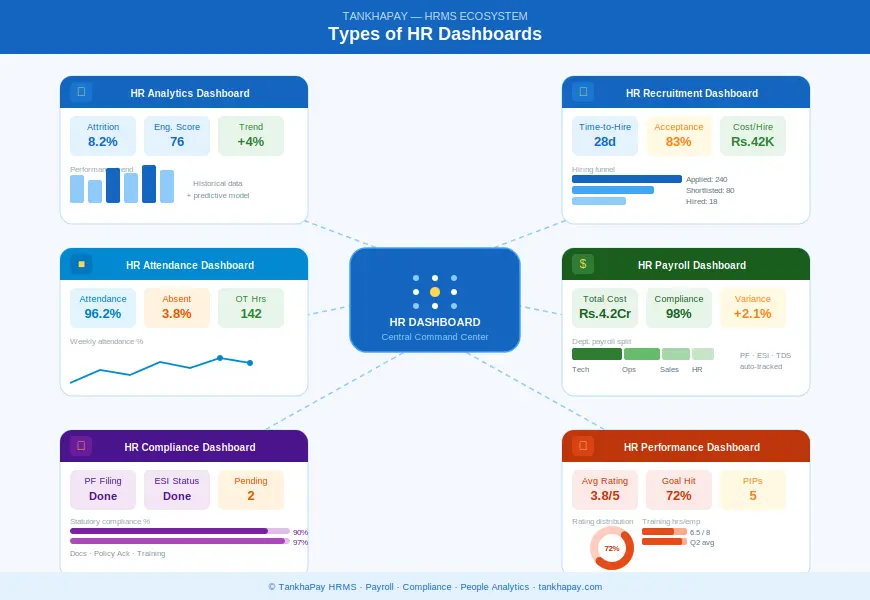
HR dashboards are far from generic. Different organizations require different dashboards for their specific requirements. Let’s see some of the major types of dashboards:
1. HR Analytics Dashboard
The HR dashboard is not merely a surface-level measure. It takes into account historical data and models to provide more insight — for example, by helping identify those likely to leave the organization, predict future hiring needs, and pinpoint performance drivers.
Key metrics typically included:
- Voluntary and involuntary employee attrition rates
- Satisfaction rate trends
- Performance measures of different departments
- Relationship between training time and productivity
2. HR Attrition Dashboard
The HR attrition dashboard is one of the most strategically valuable tools for any people team. Employee turnover is expensive — research consistently shows that replacing an employee can cost anywhere from 50% to 200% of their annual salary.
An attrition dashboard allows HR professionals to:
- Measure turnover rates by department, length of service, age cohort, or job function
- Detect at-risk cohorts before waves of resignations take place
- Understand factors behind employees’ decision to quit (based on exit interviews)
- Benchmark their attrition rates against industry standards
3. HR Headcount Dashboard
The HR headcount dashboard tracks the total number of active employees, new hires, and exits within a given period. It gives HR and finance teams a real-time view of workforce size — critical for budgeting, capacity planning, and compliance.
Typical metrics:
- Overall employee numbers broken down per department/branch
- Monthly variations in overall employee number
- Ratio of full-time to contract to part-time employees
- Number of open positions compared to authorized numbers
4. HR Payroll Dashboard
The HR payroll dashboard is an important tool for payroll specialists and financial departments.
Some important payroll measurements are as follows:
- Comparison between payroll cost and budgeted payroll cost
- Payroll processing time
- Compliance level regarding PF, ESI, and TDS under the Indian context
- Salary increment and revision details
- Department-wise overtime cost
In the case of payroll management platforms such as TankhaPay, the importance of having a payroll dashboard becomes very prominent in order to eliminate errors.
5. HR Recruitment Dashboard / HR Hiring Dashboard
The HR recruitment dashboard (also called an HR hiring dashboard) tracks everything from job posting to onboarding. It helps talent acquisition teams measure the efficiency of their hiring pipeline.
Common recruitment metrics:
- Time to hire and fill positions
- Source of recruit (Job portals, referrals, social media)
- Acceptance rate
- Cost-per-hire by department
- Interview-to-offer conversion rate
6. HR Performance Dashboard
HR performance dashboard links human resource management with organizational performance. The dashboard provides consolidated information about performance assessment scores, attainment of goals, 360-degree evaluation results, and learning progress.
What it tracks:
- Individual and group performance ratings statistics
- Goal attainment percentage
- Training completion rates
- Status of PIPs
7. HR Attendance Dashboard
The HR attendance dashboard helps monitor the attendance and absenteeism pattern of employees. This dashboard can be quite useful for businesses with a large number of hourly workers or shifts.
Key metrics:
- Daily, weekly, and monthly attendance rates
- Leave type breakdown (sick, casual, earned)
- Absenteeism trend by department
- Late arrivals and early departures
8. HR Compliance Dashboard
HR attendance dashboards offer real-time insights into attendance trends among employees. This dashboard is especially helpful to companies that have a sizable hourly workforce.
Compliance metrics tracked:
- PF, ESI, and TDS filing status
- Contract and documentation compliance percentage
- Training completion for mandatory programs
- Policy acknowledgement rates
9. HR Operations Dashboard
The HR operations dashboard is the day-to-day management tool for HR administrators. It provides a bird’s-eye view of all ongoing HR activities — from offer letter generation to exit formalities.
10. HR Executive Dashboard / HR Business Intelligence Dashboard
The HR executive dashboard (or HR business intelligence dashboard) is designed for C-suite leaders and board members. It summarizes the most critical workforce insights in a high-level, visual format — without requiring leaders to dive into raw data.
Typical KPIs on an executive HR dashboard:
- Total headcount and total cost of employees as a percent of revenue
- Total attrition rate compared to last year’s rate
- Diversity and inclusion statistics
- Quality of leadership pipeline
- Employee engagement measure
11. HR MIS Dashboard
The HR MIS (Management Information System) Dashboard is the main source of HR reporting. All HR information from different modules, including payroll, attendance, leaves, and performance, is collected and displayed in one unified view for internal use in governance and audits.
12. HR Shared Services Dashboard
The HR shared service dashboard monitors the performance of the service delivery process in companies that have centralized HR shared services centers. Metrics that are measured include tickets closed time, volume of queries, and employee satisfaction levels.
HR Dashboard vs. HR Report: What’s the Difference?
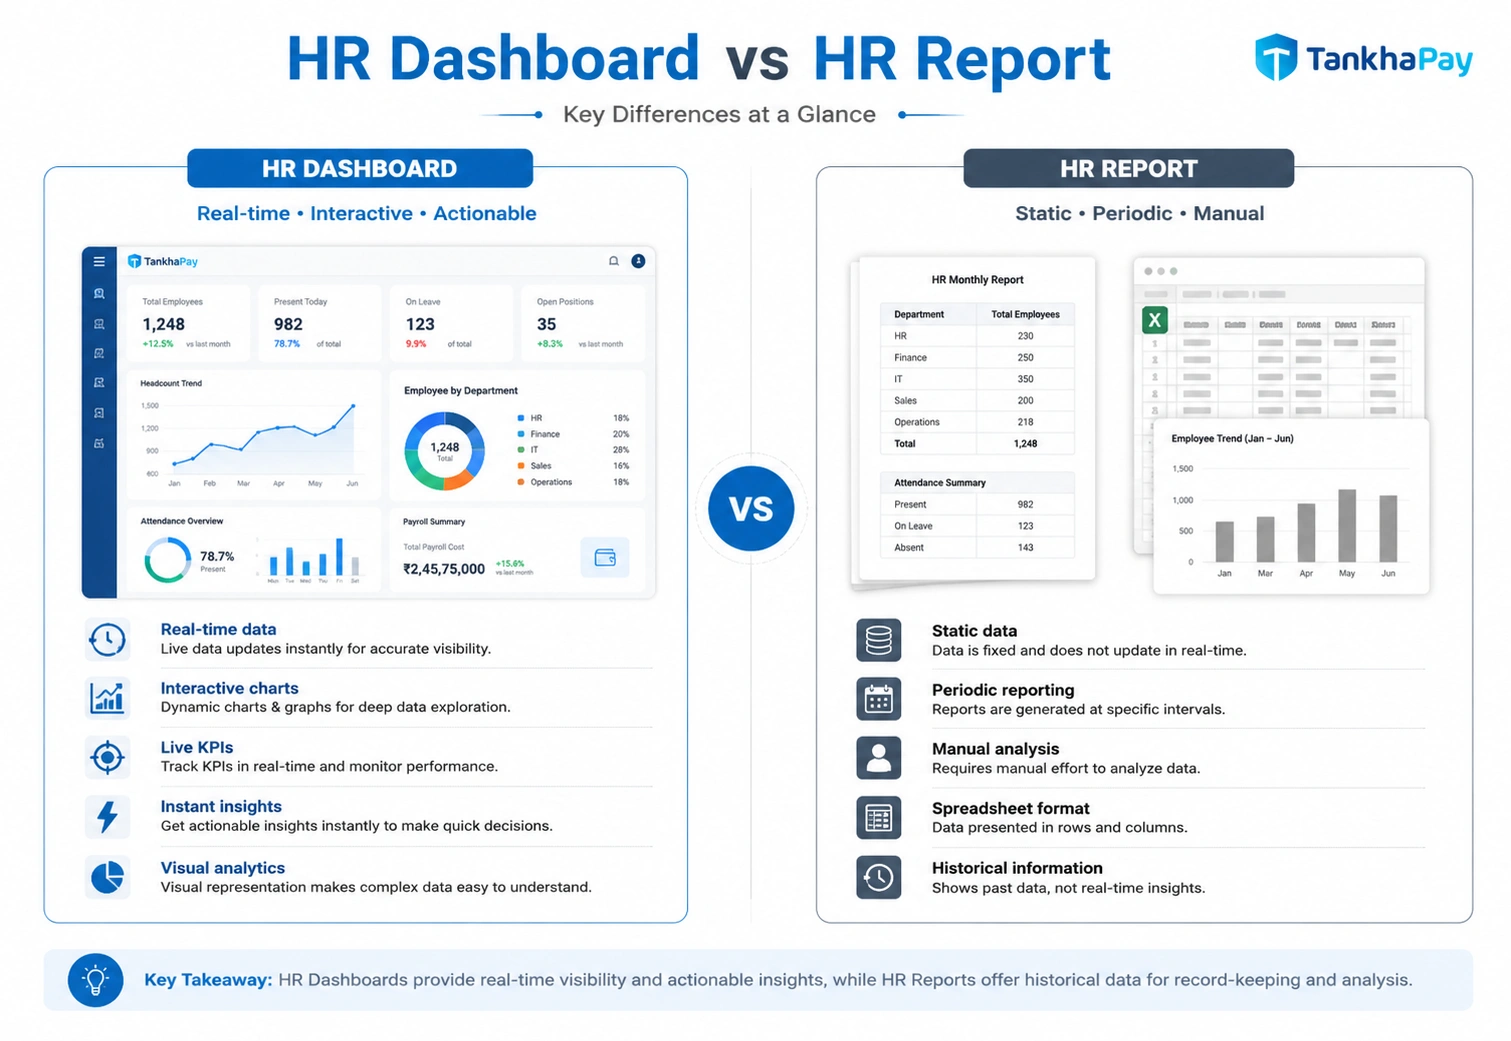
Many HR professionals use these terms interchangeably, but there’s an important distinction:
| Format | Visual, interactive | Text/table-heavy, static |
| Update Frequency | Real-time or scheduled | Periodic (monthly/quarterly) |
| Primary User | Decision-makers, managers | Analysts, auditors |
| Purpose | Monitor & act | Document & audit |
| Depth | High-level with drill-down | Detailed and comprehensive |
| Accessibility | Self-service | Requires HR team to generate |
| Best For | Daily/weekly oversight | Compliance, deep analysis |
Both are valuable — but in today’s fast-paced work environment, HR dashboards give organizations the speed they need to stay ahead of workforce challenges.
HR Dashboard Content: What Should You Include?
The quality of your HR dashboard depends entirely on what you put in it. Here’s a practical guide to the HR dashboard content that matters most:
Must-Have HR Dashboard Metrics
Workforce Composition
- Number of people (full time/part time/contractual)
- Ratio of gender diversity
- Employee distribution by department wise
- Geographical distribution
Recruitment & Talent Acquisition
- Number of open positions
- Time-to-hire
- Offer acceptance rate
- Onboarding completion rate
Attendance & Leave
- Attendance rate (%)
- Average leave days
- Absenteeism rate per team
- Overtime recorded
Payroll & Compensation
- Total payroll expenses
- Average payroll cost per employee
- Revision of salaries as per cycle
- Payroll error rate
Performance & Engagement
- Average performance rating
- Goal completion rate
- eNPS (Employee Net Promoter Score)
- Training hours per employee
Attrition & Retention
- Overall attrition rate
- Voluntary vs. involuntary turnover
- Average employee tenure
- High-performer retention rate
Compliance
- Statutory filing completion rate
- Policy acknowledgement rate
- Pending compliance actions
How to Create an HR Dashboard: A Step-by-Step Guide
It takes more than an advanced degree in data science to create an HR dashboard. It requires an actionable step-by-step approach.
Step 1: Define Your Objectives
Always start with the “why.” Do you need a dashboard for executive-level reporting, day-to-day business operations, monitoring payroll, or assessing your talents? All this will affect your dashboard creation process.
Step 2: Identify Your Audience
An HR admin dashboard for an HR executive looks very different from an HR executive dashboard for the CEO. Tailor the complexity, depth, and format to the end user.
Step 3: Select the Right HR Metrics and KPIs
Not all data will have a place on your dashboard. Make sure you use metrics that are:
- Actionable (lead to a certain decision or action)
- Relevant (have some relevance to your business objectives currently)
- Measurable (available and precise data is used for these metrics)
- Timely (updated with a certain frequency)
Step 4: Choose Your Data Sources
Map out where your data lives:
- HRMS / HCM platform
- Payroll software (e.g., TankhaPay)
- Attendance and biometric systems
- Learning Management Systems (LMS)
- Performance management tools
- Recruitment platforms (ATS)
Step 5: Select Your Dashboard Tool or Software
You have several options depending on your budget and technical capability:
Dedicated HR Dashboard Software:
- Integrated HRMS platforms with built-in analytics (like TankhaPay)
- Standalone HR analytics tools
BI Tools with HR Templates:
- Microsoft Power BI
- Google Looker Studio (free)
- Tableau
HR Analytics Excel Dashboard: The HR analytics Excel dashboard remains popular in mid-size organizations and startups. Excel offers flexibility through pivot tables, slicers, and charts — though it requires manual data updates and lacks real-time capability.
Step 6: Dashboard Layout
Design your dashboards based on the following best practices:
- Place the most critical KPIs at the top (above the fold)
- Use consistent color coding (red = concern, green = on-track, yellow = watch)
- Eliminate clutter – white space is your best friend
- Utilize drill down capability where possible
- Ensure mobile optimization
Step 7: Test, Validate, and Launch
Prior to launching your dashboard, make sure you have tested it using real-world data. This will help you ensure that the calculations on your dashboard are correct, your data sources are integrated properly, and that your dashboard is responsive.
Step 8: Review and Iterate
Remember, an HR dashboard is an ongoing process, and therefore, you should schedule quarterly reviews for adding new metrics and removing old ones.
HR Dashboard Samples and Templates
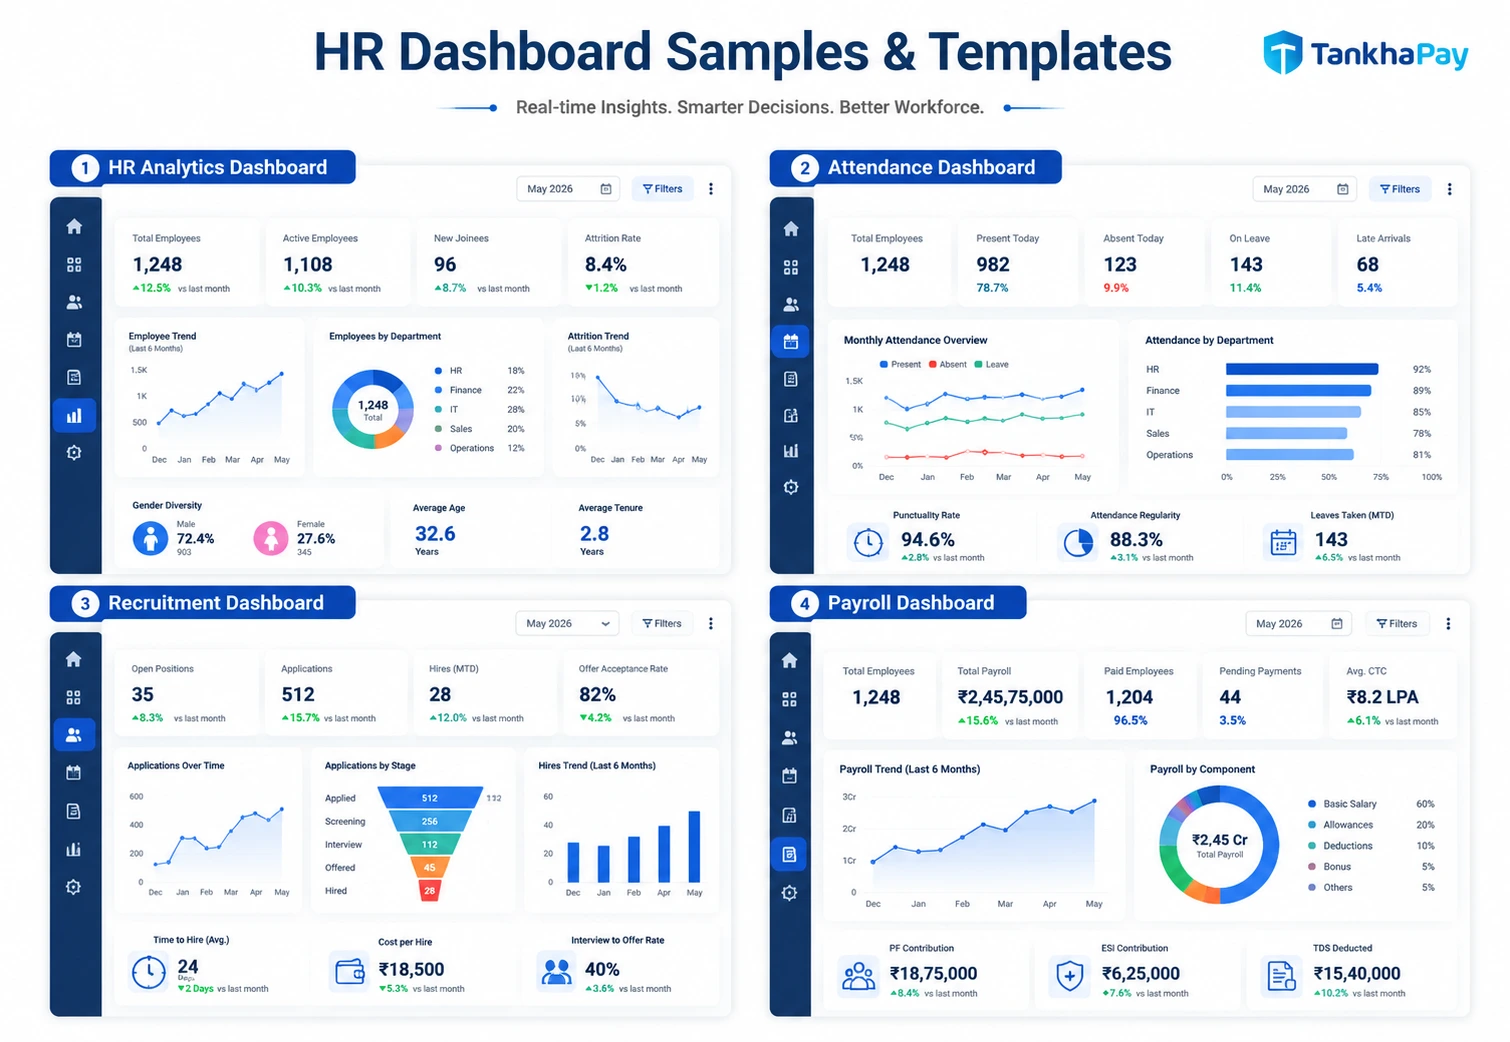
Seeking a pre-made format? Then here are some examples of common HR dashboard samples, along with what they contain:
Common monthly components in HR dashboard:
- Monthly snapshot – headcount, hiring, turnover
- Attendance overview and trends for the month
- Payroll snapshot and variance analysis
- Vacant positions/recruitment overview
- Attrition risks identified
HR Metrics Dashboard Template (Structure)
| Workforce Overview | Total headcount, new hires, exits, net change |
| Attendance | Attendance rate, absenteeism, leave utilization |
| Payroll | Total payroll cost, per-employee cost, compliance status |
| Recruitment | Open positions, time-to-fill, cost-per-hire |
| Performance | Average rating, PIP count, goal attainment |
| Attrition | Attrition rate, high-risk employees, exit reasons |
| Compliance | Filing status, pending actions, documentation gaps |
| Engagement | eNPS score, survey participation rate |
HR Management Dashboard Template (KPI Summary)
| Monthly Attrition Rate | < 2% | 1.8% | ✅ On Track |
| Time-to-Fill (Days) | < 30 | 34 | ⚠️ Watch |
| Payroll Compliance | 100% | 98% | ⚠️ Watch |
| Training Hours/Employee | 8 hrs/month | 6.5 hrs | 🔴 Below Target |
| Attendance Rate | > 95% | 96.2% | ✅ On Track |
| eNPS Score | > 30 | 28 | ⚠️ Watch |
| Offer Acceptance Rate | > 80% | 83% | ✅ On Track |
Best HR Dashboards: Features to Look For
When evaluating the best HR dashboards — whether built in-house or through software — look for these capabilities:
- Real-time or near-real-time data updates — no stale information
- Role-based access control — HR admins, managers, and executives see different levels of detail
- Drill-down capability — click on a summary number and go deeper
- Customizable KPI selection — not a one-size-fits-all approach
- Mobile accessibility — Mobility and dashboard functionality on smartphones and tablets
- Export and sharing options — PDF, PPT or scheduled emails
- Notification system – automatic alert when key performance indicators cross predetermined levels
- Integration with existing systems — seamless connection to payroll, HRMS, ATS, etc.
HR Dashboard Benefits: Why Every Organization Needs One
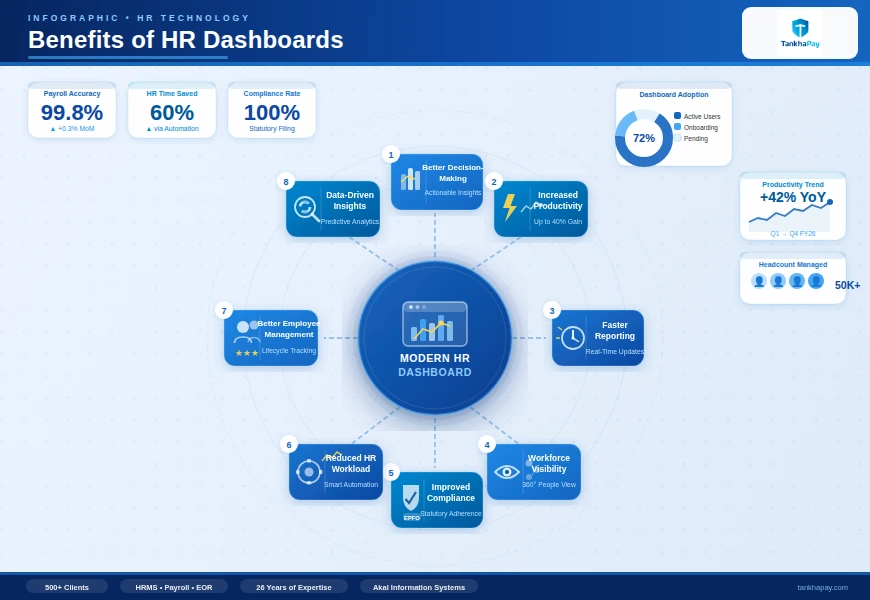
1. Faster, Better Decision-Making
HR dashboards eliminate the lag between data generation and decision-making. Instead of waiting for a monthly report, managers can spot problems and act on them the same day.
2. Improved HR Accountability
When such metrics become apparent and monitored regularly, Human Resources teams are held accountable for achieving desired results.
3. Proactive Workforce Management
The shift from reactive to proactive HR management is one of the biggest competitive advantages organizations can build. An attrition dashboard, for instance, can flag at-risk employees weeks before they resign — giving HR time to intervene.
4. Stronger Business Alignment
The HR business intelligence dashboard is a way for HR professionals to link people data with business performance.
5. Compliance Risk Reduction
With a dedicated HR compliance dashboard, organizations can monitor statutory filing deadlines, documentation gaps, and policy gaps in real time — reducing the risk of costly penalties.
6. Better Employee Experience
If HR professionals have clear visibility into attendance problems, outstanding leave requests, and employee performance problems, they will resolve these problems quickly and make employees’ lives easier.
Challenges in HR Dashboard Implementation (And How to Overcome Them)
Even the best designed HR dashboard will be unsuccessful unless implemented properly. Here are a few implementation challenges and their possible solutions:
| Poor data quality | Inconsistent data entry across systems | Standardize data collection; implement data validation rules |
| Low adoption | Dashboard too complex or irrelevant | Co-design dashboards with end-users; keep it simple |
| Siloed data | HR, payroll, and operations data in separate systems | Use an integrated HRMS with a unified data layer |
| Outdated information | Manual data refresh processes | Automate data pipelines and schedule refreshes |
| Lack of HR analytics skills | Limited internal expertise | Invest in training; use no-code/low-code BI tools |
| Data privacy concerns | Sensitive employee data on shared dashboards | Implement role-based access controls; data masking |
HR Dashboard in the Indian Context: What’s Different
For HR teams managing India-based workforces, HR dashboards need to account for specific regulatory and operational realities:
Statutory Compliance Tracking — India’s complex compliance landscape (PF, ESI, PT, TDS, Gratuity, Bonus Act) makes a dedicated HR compliance dashboard not just valuable, but essential. Missed deadlines can result in penalties and legal exposure.
Labour Law Adherence — Tracking working hours, overtime, minimum wage compliance, and contract worker data is mandated under various central and state labour laws.
Multilingual and Multi-Location Workforce — Many Indian organizations operate across multiple states with different minimum wages, state-specific labour laws, and even different payroll cycles. HR dashboards need to accommodate this complexity.
Festival and Leave Calendar Integration — India’s rich calendar of national and regional holidays makes leave and attendance tracking more complex than in many other markets.
A good HR attendance dashboard should integrate state-specific holiday calendars automatically.
TankhaPay, made for the specific purpose of addressing the Indian labor market, takes care of these aspects with built-in compliance management, payroll dashboards customized for Indian statutory requirements, and attendance management features for flexible work shifts.
Real-World Use Cases: HR Dashboards in Action
Use Case 1: Reducing Attrition in a Fast-Growing Startup
A 500-person strong fintech startup was experiencing an attrition rate of 28% per year – more than double compared to other companies in its field. The HR team created an attrition HR dashboard where tenure, department, performance rating, and managerial evaluation could be analyzed together, finding out that 60% of leavers were from one department only.
Outcome: Manager training and department reorganization helped to cut the rate of employee turnover in that department by 40% within six months.
Use Case 2: Payroll Compliance for a Multi-State Manufacturing Company
An organization operating in eight different states had problems with PF and ESI payments due to a lack of compliance. The HR payroll management system developed using HRMS revealed compliance issues in each state.
Outcome: Compliance filing accuracy improved to 99.8%, and the company avoided a significant statutory penalty.
Use Case 3: Recruitment Efficiency for a Retail Chain
A retail company experiencing high seasonality in hiring requirements utilized the HR recruitment dashboard to track time-to-fill metrics in relation to their 150 store locations. The results revealed that certain areas were experiencing a time-to-fill period greater than 45 days for vital floor workers.
Outcome: By redirecting sourcing budgets to higher-performing channels for underperforming regions, they reduced average time-to-fill by 12 days — saving significant costs during peak season.
Frequently Asked Questions
What is the difference between an HR dashboard and an HR report?
HR Dashboard is a dynamic tool that uses visuals to give current or almost current information for the purpose of monitoring. The HR Report is static information produced on a regular basis for analysis and documentation purposes.
What should an HR dashboard include?
There are several elements that an effective HR dashboard must feature, including headcount/attendance records, payroll records, recruitment figures, retention and attrition statistics, performance metrics, and compliance data.
How do I create an HR dashboard in Excel?
For creating an HR analytics dashboard using Excel, gather your HR data in spreadsheet form, then create pivot tables, prepare charts such as bar charts, line graphs, pie charts, use slicers for interaction purposes, and organize all these things in a master dashboard. Although Excel dashboard is useful for small teams, it does not provide real-time data.
What is an HR attrition dashboard?
An HR attrition dashboard is a specialized dashboard that tracks employee turnover data — including voluntary and involuntary exits, attrition rates by department/tenure/role, reasons for resignation, and trends over time. It helps HR teams proactively manage retention.
What is the best HR dashboard software?
There is no one-size-fits-all answer to that question; it depends on the size, budget, and technology environment at your company. Software options include native HR dashboard applications included in HRMS packages (such as TankhaPay for Indian companies), or BI software such as Power BI, Tableau, and Looker Studio. The best software for an organization in India will likely be a complete HR package with dashboards.
How often should an HR dashboard be updated?
A day-to-day or real-time update is recommended for operational HR dashboards, such as attendance and payroll dashboards. Weekly or monthly updates will work for strategic HR dashboards, such as attrition and performance.
What is an HR MIS dashboard?
An HR MIS (Management Information System) dashboard aggregates all HR data across functions — payroll, attendance, recruitment, performance — into a unified management view. It is primarily used for internal governance, audit readiness, and senior management reporting.
What is an HR portal dashboard?
An HR portal dashboard is the personalized home screen employees and managers see when they log into an HR self-service portal. It typically shows an individual's attendance summary, leave balance, payslip status, pending tasks (like appraisals), and important announcements — giving every employee a personalized view of their HR data.
Can small businesses benefit from HR dashboards?
Yes, absolutely! Even companies that have 50 to 100 employees find great value in having HR dashboards in place. This saves a lot of time on compiling reports manually and makes it easier to keep track of compliance. Also, smaller HR departments can use their time more strategically instead of collecting data.


: 16 Companies Scored on Compliance")


: Differences, Costs & Which Hiring Model Is Right for Your Company?")
: Cost, Compliance & Decision Framework for Hiring in India")


